
The Most Valuable Plays of the Year (Updated)
Through games of June 5. Note that 4 new entries into the top ten came between Thursday and Sunday just passed. Note also that Ryan Church has 3 in the top 11.
Here are the top ten:
1. 4/21 Guzman's throwing error against the Braves (-8.33)
2. 4/12 Schneider's 2-out double against the Braves (7.35)
3. 6/2 G. Bennett's double in the 8th against Atlanta (6.92)
4. 6/3 R. Church's sac fly in the 11th to beat Florida (6.04)
5. 5/24 R. Keisler's base hit in the 14th for the Reds (6.04)
6. 5/18 Hammonds single in the ninth(6.04)
7. 5/8 Vizquel's double in the 13th inning (6.04)
8. 5/24 L. Lopez GIDP in the 11th for the Reds (-5.84)
9. 6/3 N. Bump's botched throw to second in the 11th (-5.84)
10. 6/5 R. Church's homer in the 8th against Florida (5.39)
Here are the next 8:
11. 5/7 Ryan Church's double in the ninth against the Giants (5.37)
12. 5/24 L. Lopez double in the 14th for the Reds (5.32)
13. 6/3 V. Castilla popping out in the 11th (-4.80)
14. 5/10 Troy Glaus's 3-run homer in the sixth in Arizona (4.52)
15. 4/6 Jose Guillen's homer in the 8th against Tim Worrell in Philly (4.48)
16. 5/11 Chad Tracy's bloop single in the 8th in Arizona (4.32)
17. 4/10 Paul LoDuca's double in the 7th in Florida to give them the lead 2-0(4.26)
18. 5/7 Moises Alou grand slam in San Francisco (3.96)
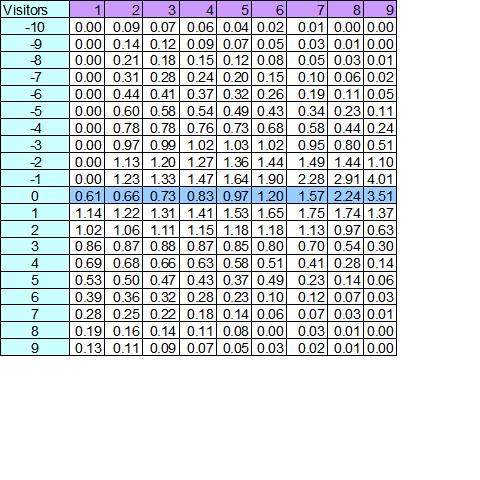
Edit: New reader Sec. 210 rightfully asks for some explanation of these numbers. The numbers above are WV, or Win Value. Win Value is Run Value adjusted to reflect the score and inning of a game. RV is equivalent to runs (e.g. a solo home run is worth 1.0 RV). Win Value takes RV and mutiplies it by an adjustment factor. For example, the adjustment factor for the run that breaks the tie in the bottom of the ninth is 6.04, so a solo home run to win is worth 1.0 RV and 6.04 WV. In contrast, the adjustment for a solo shot by the leadoff batter in the top of the first is 0.61, so in that case, the RV is 1.0 and WV is 0.61.
Where do the adjustment factors come from? I try to explain that in this long post, as amended by this post. Short version: They are based on the effect each run has on the average team's probability of winning the game. The 6.04 WV means that play increased the teams chance of winning 6 times as much as the average run scored at any other point in the game. In contrast, the leadoff home run increased the chance to win by 6/10ths of the average run.
So, to answer Sec. 210's question, for the 5.89 WV, you can say that that play was worth nearly 6 times the average solo home run hit at any other point in the game. Or, that play helped the Nats win as much as the visiting team scoring 10 runs in the top of the first does. (i.e. add up all of the WV in the 1st inning column of this chart.
For additional background, start here (which explains ERV Scoring).
posted by DM @ 9:33 PM
2 comments
![]()


2 Comments:
It looks like I was lucky to be there for the 6/3 game! :)
The only one that looks off to me, but is understandable, I guess, is the Castilla popout. But, when the inning is as high-leverage as that, even the little plays are going to get magnified.
No need to apologize, Sec. 210 (which is right behind the Nats Blog Section 110 -- you aren't Bob Novak, are you :)?). I barely understand this system I've created.
I will edit the post to answer your question (so I can put links in it).
Post a Comment
<< Home