
Win Value Explained
[WARNING: This is a long post, with a pretty high "geek" quotient. If you are looking for the slightly less "geeky" stuff, like last night's ERV boxscore, then scroll down.]
What is Win Value? It is an adjustment to Run Value to reflect how the event realted to the ultimate point of baseball, winning the game. Recall that Run Value essentially translates every event in a game into a common currency, runs. A double play with bases loaded and one out is worth negative 1.4 runs, a leadoff walk is worth positive 0.39 runs, etc. But RV is the same whether it is the first inning, or the last inning, and regardless of what the score is. WV adjusts the RV for each event to reflect its worth relative to winning the game.
This analogy might be helpful. Runs are the currency with which wins are purchased. Like any currency, the value of runs varies over time and in different circumstances: 1 run in a tie game in the ninth is worth a whole lot more than 1 run in a 10-0 blowout. What WV tries to do is measure the value of runs at different points during the game, and come up with an adjustment value for each of those points that you multiply by RV.
So, how do we determine the value of runs based on the game situation? The game situation is simply the score differential and inning, e.g. Visitors down by 2 in the fourth. Thanks to relatively simple probability analysis, we can calculate the probability that a team will win the game from any "game situation". For example, when the Nats entered the bottom of the second tonight down by 6 runs, the average team has only a 8.7 percent chance of winning the game in that situation (assuming they are facing an average team).
How is that calculated? You start with the basic distribution of runs in an inning -- I used 2003 MLB because it was handy, but any season is a pretty large sample and it doesn't change much from year to year. It shows that for any inning (half-inning, really), 71% of the time 0 runs are scored, 16% of time 1 run is scored, 7% of time 2 runs are scored, etc. From this distribution, you can build a relatively simple model that calculates the probability that a team will score enough runs to overcome the deficit (and any additional runs the opponent would score, on average). Note that at any time the game is tied, the probability of winning is 50%, because I am only concerned with the average team, which I can use as a benchmark for evaluating performance.
So what can you do with this information? You can calculate the chance of winning for every (realistic) game situation. Then you can do something really neat, an idea I borrowed from Nate Silver at Baseball Prospectus (who was kind enough to send me his probability model, which helped me considerably). You can determine how much a particular run increases a team's chance of winning. For example, entering the bottom of the second down 6-0, the average team has a 8.7% chance of winning. If they score 1 in that inning, it goes up to 9.7%. So that run increases the chance of winning by 1%, so it is "worth" 1%.
Once you have the marginal increase in probability of winning for each run, you can determine its value precisely, and thus derive adjustments to RV. But you need to pick an "index" run to compare all values to. I picked the average
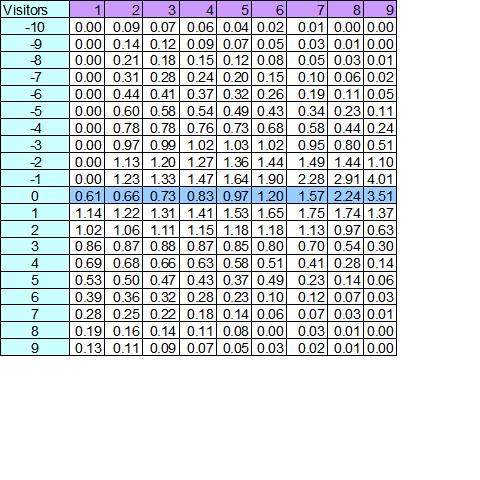
Visitors Win Value Adjustments
How do you read this chart? The run scored when the game is tied in the 3rd is worth 73 percent of the average
After I created these tables, at first I thought I was finished -- I can simply multiply the RV for each event by the adjustment in these tables based on score/inning, and I would have WV. In most cases (like the solo shot mentioned above) that works, but it is not comprehensive enough, because of the problems of multiple run events. For example, if a team hits a 2-run homer in the ninth to tie, the first run that crossed the plate didn't tie the score, so it is not worth 4.05 times the index run. It is only worth 1.10. The second run is worth 4.05, so the total WV is 5.15, not simply 2 x 4.05. Similarly, with bases loaded, each runner has a different value based on how he changes the score, and you must reflect those differences in calculating Win Value, which my spreadsheet does.
Why is this last point important? Because by doing that, you can solve what I call the "sac fly problem". From almost the very moment I came up with ERV Scoring, people questioned how it dealt with sac flies, because RV in almost every case of a sac fly is negative or barely positive, even when it might be a run that ties the game. RV is negative because the team is squandering the chance to score runs AFTER the run that comes in. But with these WV adjustments, the run that ties the game is worth 4.05, whereas the future runs (which the sac fly out negatively affects) are worth 3.5, 1.70, etc. By using the "correct" values for each run, WV can turn a negative RV for a sac fly into a positive, if the run that scores is worth more that the runs that are squandered by the out. At some point I will put together a chart that shows the situations where WV is a positive for a sac fly while the RV is negative. Also note that I carry this approach throughout all WV calculations at any point in the game to be as accurate as possible.
I hope this explanation gives you some sense of what WV represents. As always, this is a work in process, and I welcome and encourage feedback, questions and suggestions.
posted by DM @ 11:30 PM
0 comments
![]()


0 Comments:
Post a Comment
<< Home