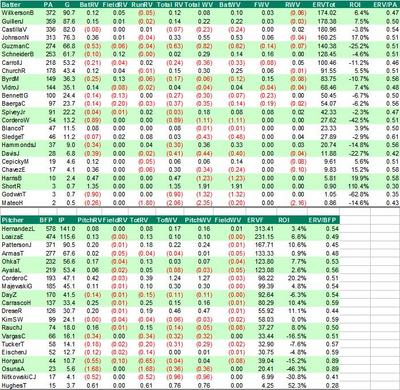
More ERV Stats
Below are some more ERV stats that I have been tracking. They are essentially all "rate stats" -- RV and WV per "game" or "inning" for each Nats Player and Pitcher (I've separate pitchers and batters here, and ignored pitchers hitting in these charts). An explanation for the columns is at the bottom of this post:
Batters
PA = Plate Appearances (note that in rare cases this may be off from the actual totals for players who appeared only as pinch runners).
RV and WV columns = This is the RV and WV each player produces or squanders per games (games equivalent, actually). In other words, RV and WV divided by G.
ERVTot. = ERVTot is the total Expected Run Value for the team for all PAs for that batter. For example, if a batter leads off an inning, he gets 0.53 (the ERV at that point for the team) added to his ERVTot. If he comes up with Bases Loaded, he gets 2.25 added to his ERVTot. It is a measure of the scoring situations the player has faced.
ROI = Return on Investment. This is the players total Batting RV for the season (see Friday Morning Figures for that) divided by his ERVTot. I view this as how well the player has invested the run currency he was given in his at bats. Like any investment, a player can lose money. Note that the ERVTot is a team-based figure, as it reflects the runs the team is expected to score, not just that player. So you would not expect the player to have anything close to 100% here, though that can happen in an individual game (the ERV Boxscores show ERVTot under the column ERVPA). Nick Johnson is our best investor, earning a 17% return on the Nats money. Wil Cordero is the worst, losing over 40% of our expected runs in his at bats.
ERV/PA = This is simply ERVTot divided by PA. It is a measure of the "leverage" each batter faces on average. As you would expect, Wilkerson's is pretty low given that he leads off, and pinch-hitters are pretty high, given that they usually bat with men on base. For comparison, the ERV table I'm using says the leadoff hitter in every inning comes to the plate with an ERV of 0.53.
Pitchers
BFP = Batters faced by the pitcher
IP = Equivalent innings pitched, based on 4.1 batters per inning (37 BFP divided by 9).
RV & WV = Pitching and Fielding RV and WV per inning.
ERVF = The pitcher's version of ERVTot -- the total ERV faced by opposing batters faced by that pitcher. Note that unlike the batters, the pitcher has some control over this figure, in that if he is mowing them down, his ERVF is pretty low because he's not giving the opponents scoring opportunities.
ROI = Return on Investment, total Pitching RV divided by ERVF. Similar to the batters, although the because the pitcher can control the denominator somewhat, those who pitch to the score will have a relatively low number here, like Livan Hernandez. I'm still puzzling over what this number actually means, and whether there is a better way to calculate this.
ERV/BFP = The average ERV faced by the pitcher for each batter, a measure of the leverage the pitcher faces. Relievers who come in in the middle of innings generally have the higher number here.


0 Comments:
Post a Comment
<< Home