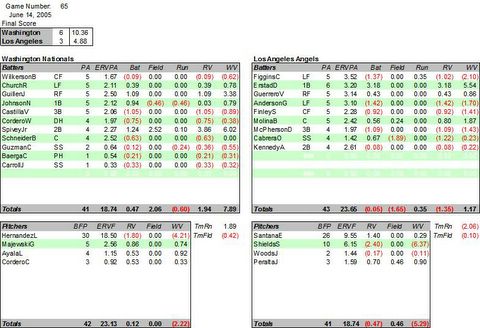
ERV Boxscore for June 14, at California
The problem with baseball is that, although it appears to be pretty static, it has a number of moving parts that make it hard to tell why things happened. For the first six innings last night, I thought our feeble mid-May bats had returned and were the source of the problem. But that turned out to be Ervin Santana, and as soon as he left, and Frank fingered the cheater Donnelly, and Scioscia reacted like a baby, Santana's spell was not only gone, it had backfired and was now confounding the Angels. The rest is not only history, but another signpost game for us to look back on when the season is over.
ERV Win: Spivey & Guillen
ERV Loss: Shields
(1) Guillen HR in 8th (3.49)
(2) Spivey diving stop in 4th (2.97)
(3) Spivey go ahead single in 8th (2.73)

Click on boxscore for larger image.


5 Comments:
Amusing, but also necessary, to avoid having his play with the Brewers against the Nats from showing up in the totals.
Where does the ERV matrix that you are using to generate these box scores come from? How many years of data does it encapsulate? I'm curious largely because if the values are very unstable from year to year you might end up with a very different box score if you used a different year's ERV figures -- perhaps even if you went back and re-scored games at the end of the season using that season's overall ERV figures.
Not knowing overmuch about ERV, I guess I'm simply asking: how stable are the expected values of runs scored from each game state? Are they largely the same from year to year, with minor and inconsequental variations?
We are using an the average of the 2002, 2003 & 2004 MLB ERV tables from Baseball Prospectus. There does not appear to be much variation over those three years, particular as to the difference between the various states. I can change it at any time easily, so I can test that theory, I just haven't had the chance.
Cool. I'd be curious to see if changing the ERV values made any significant difference.
Do you have a fuller explanation for the various columns in your ERV boxscore sheet? I poked around in the blog history and I get the basic idea, but I'm not completely clear on all of the details. In particular, do you explain someplace how you're evaluating pitchers? Maybe I just missed that post.
I've been meaning to do a "How to Read an ERV Boxscore" diagram, but haven't gotten to it. Here are the basics for some of the less obvious columns:
(1) ERVPA is a total of the expected runs (for the team) for each plate appearance for that batter. E.g. If you leadoff an inning, you get 0.53 added to your ERVPA. It gives you some sense of the scoring opportunties the batter faced, and dividing the Batting RV by it gives you a sense of how he capitalized on those opportunities, sort of a Return on Investment. For the season, the highest RoI on the team is about 15-18%.
ERVF is the pitcher's version of ERVPA -- a total of all the ERV for each plate appearance the pitcher faced. It gives you a sense of the danger the pitcher was in during his time out there. There is probably more to be done with this stat, but I haven't had the time.
Pitcher's are simply evaluated by getting the negative of the batter's RV/WV -- they are on the other side of the balance sheet. The exceptions to this are for Errors, Outstanding Fielding Plays and Baserunning, which are credited to the runners, fielders or to the team running and fielding generally. WPs and Balks are recorded in the pitcher's fielding column, not his pitching column.
Post a Comment
<< Home