More on Sacrifice Bunts
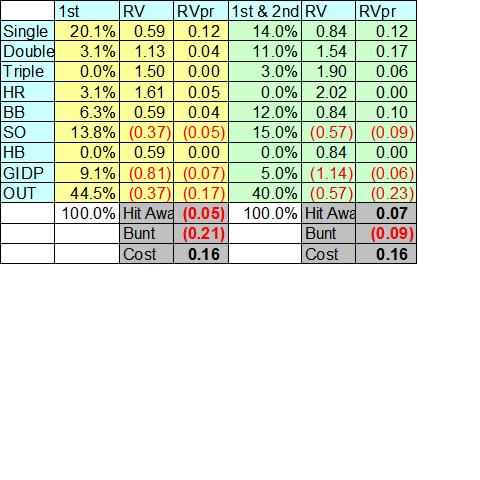
Since it appears that Frank's fetish with sac bunts will be with us all season, I wanted to explore more what it was costing us exactly. So I put together this chart. It shows the probable RV from allowing the average Nats hitter to hit away with a runner on First and No outs, and runners on 1st and 2nd, no outs. I pulled the Nats team stats for Runner on 1B and Runners on 1b & 2B from mlb.com for the 2005 season so far, and used these to calculate the probability of various events. I then multiplied that probability by the RV for each of those events. I was conservative here, in that I assumed only that runners advanced one base on a single, two on a double, etc. Note also that I assumed the sac bunt is succesfully executed.
Essentially, in either case of 1st or 1st & 2nd, allowing the average Nats hitter to hit away will earn 0.16 more RV than bunting. If you think the batter is better than the average Nat, or has less chance of striking out or hitting into a double play, then the RV difference is even greater.
Also, I played around with the chart, and determined that, keeping all other events constant, you would have to have a batter who has a 50% chance of hitting into a DP with a runner on first to make the bunt the right move, which is 5 times the average for the Nats so far this year. (For 1st&2nd, you need a 35% chance of a DP, which is 7 times the Nats average).


0 Comments:
Post a Comment
<< Home