
The Nats ERV Table
Below you will see the Expected Run Value chart for the Nationals this year, through games of August 5. As a refresher, this chart shows you the average number of runs the Nats scored after certain states in the inning, e.g. with a runner on 3rd and 1 out, the Nats, on average, scored 0.95 runs in the rest of the inning.

For comparison purposes, below is a table that shows the difference between the Nats ERV Table and the MLB 2005 ERV table for all of baseball. It shows that the Nats generally do not do as well with 2 outs as the MLB average, though we are better with bases loaded by a large margin.
 Unfortunately, we don't find ourselves in the bases loaded situation very much, as this table shows the percentage of at bats for each of the various inning states:
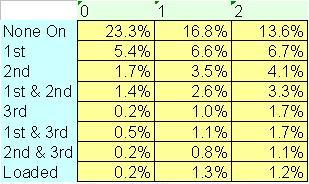
posted by DM @ 10:35 AM
0 comments
![]()


0 Comments:
Post a Comment
<< Home